Plausible is great for client-side analytics. It is super simple to set up and super simple to understand the dashboard. Google analytics and alternatives like posthog are immediately difficult to grok. All I want is simple analytics showing me where my users are going and how much traffic I am getting, and Plausible does a great job of that.
Prometheus + Grafana are typically used for server-side metrics. I've found that it can be a bit complicated to set up prometheus and create grafana dashboard for all of the various charts I want to look at. So I decided to set up self-hosted Plausible and push metrics from my server to see if this would work as a super simple server-side analytics solution.
Setup Process
The self-hosted solution was pretty easy to set up. Was it easier to set up than self-hosted Grafana? Doubtful. But overall it took me about 30 minutes to get it running on my VM. I did have to upgrade my VM to 8GB RAM since the docs recommended a minimum of 4GB RAM for running Plausible. That's a huge amount and is apparently because the ClickHouse database is very RAM hungry. Anyways the self-hosted setup process was fine except for the twenty-something more dollars per month I'm now spending on my VM.
Pushing metrics from my server was also very simple. There are community-supported SDKs for just about every language, including Go, so I was able to import that into my code, create a small wrapper package in my codebase, create an API key in the self-hosted plausible UI. Finally, my helpful assistants Cursor and Claude filled out the rest of the code while I pressed the tab key a jillion times.
How Does it Look
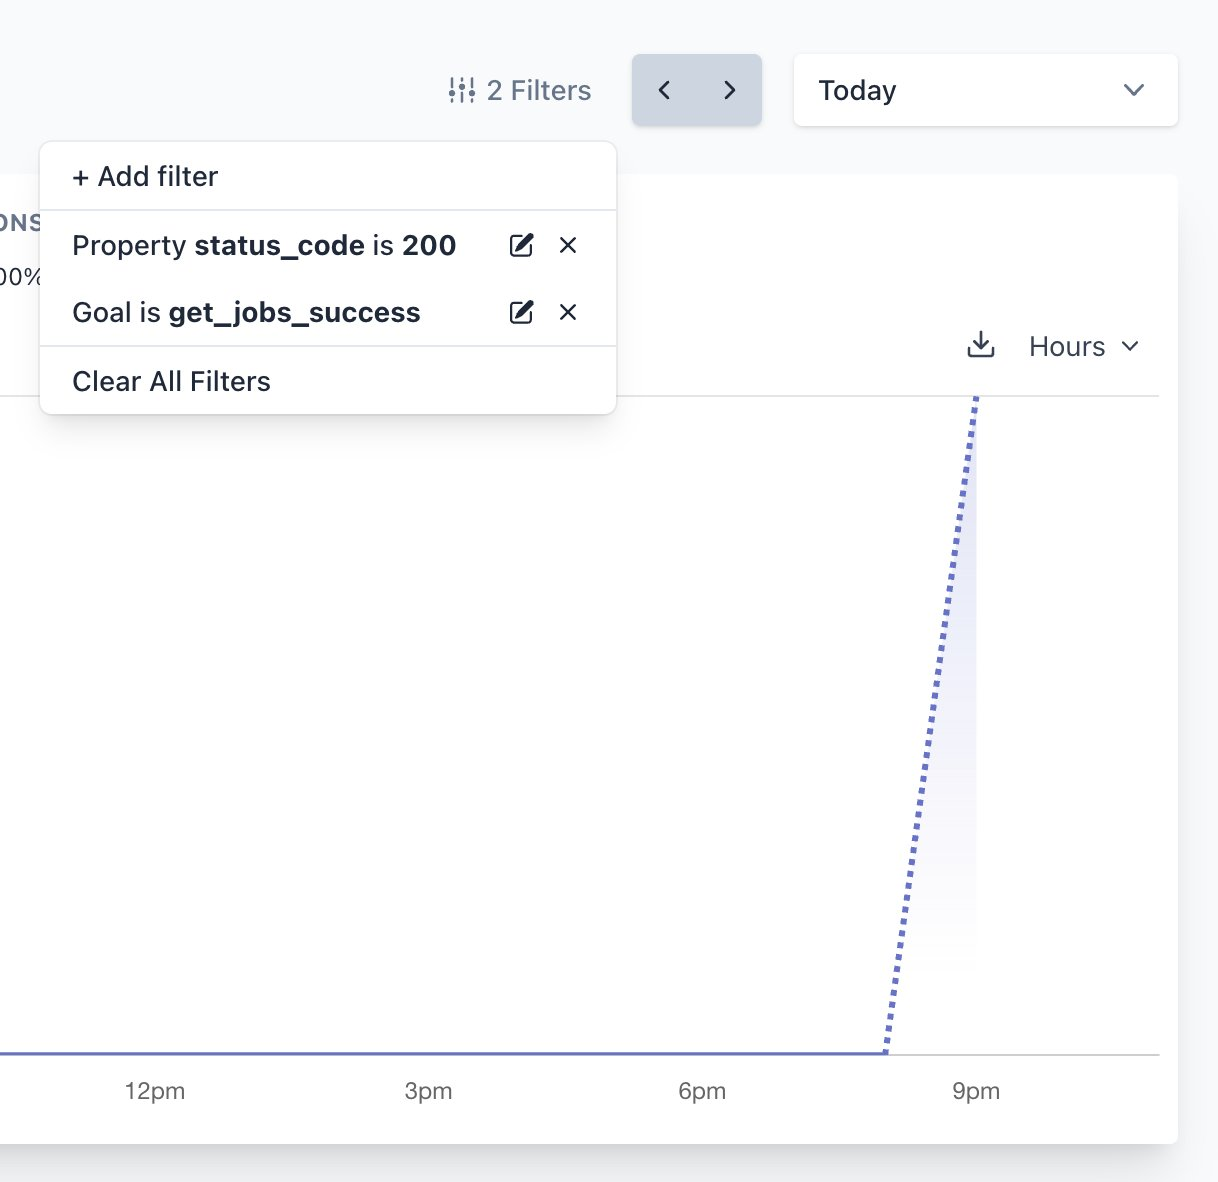
Pretty bad. I should have realized this before I started, but Plausible really is made for client-side analytics and server-side analytics is very obviously is not designed at all into the UI. Metric tags are split into "goals" and "properties." So I was pushing events with a name (goals) and a map of properties. This is useful for filtering, as you can see in the below images.


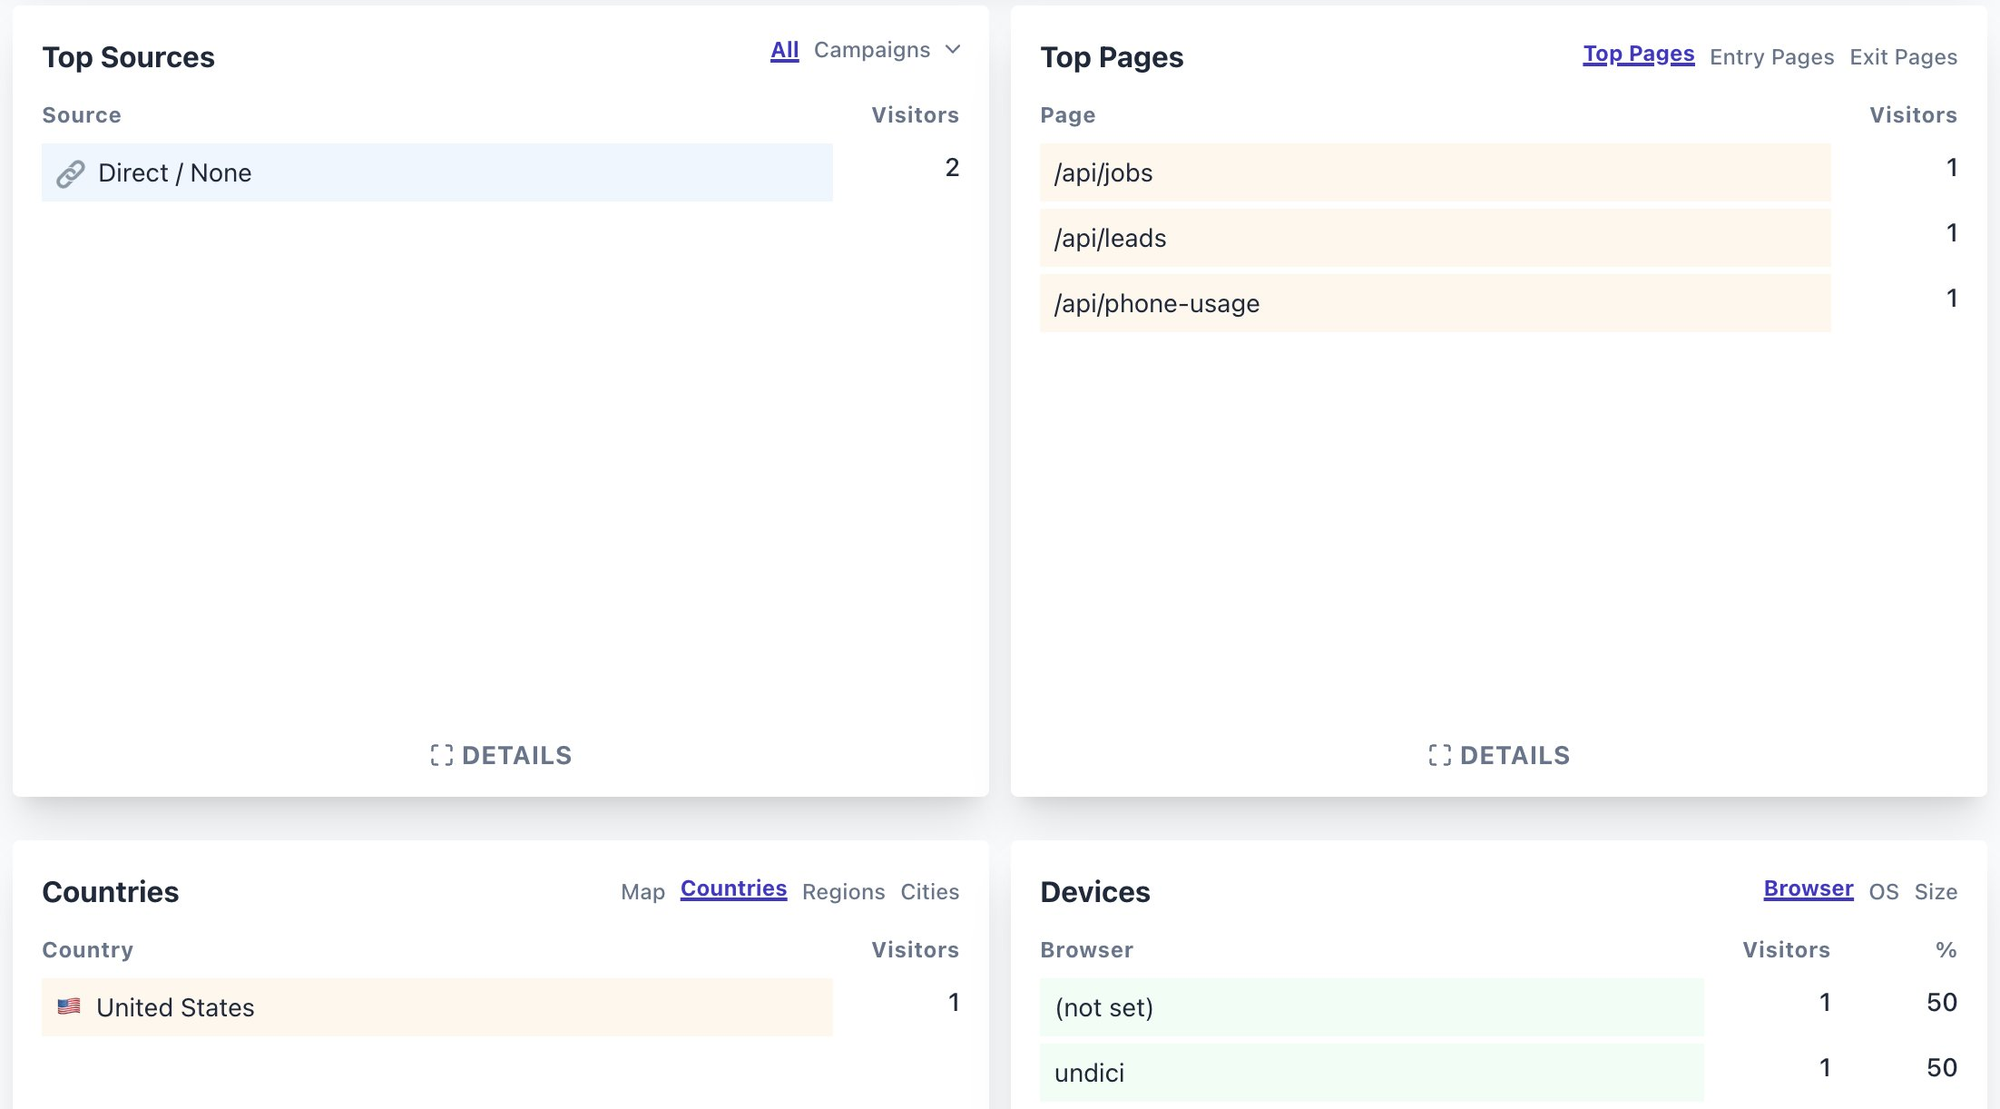
The problem is, the goals and properties section in the UI is at the very bottom. Above that are 4 sections that are useful for client-side analytics, but completely useless for my server-side analytics. My svelte-kit app proxies its requests from client -> svelte-kit server -> go server, and the svelte-kit server overwrites the User-Agent header so it will always be the same. The "Top Pages" section seems like it would be somewhat useful, but it does not differentiate between request methods, so GET and POST requests are each treated the same.

Conclusion
This was really simple to set up and Plausible is very obviously made for client-side analytics so I really shouldn't be too picky. But still I am disappointed. I think with the simple addition of being able to move sections in the UI and optionally hide them, this would be a really nice dashboard. But as of now I'm not too happy with it.
Additionally, I'm guessing I was wrong in thinking that this would be significantly easier to setup than Prometheus + Grafana. My main gripe with Grafana is how long it takes to make various charts, but I only take so long because Grafana gives me the ability to show lots of variations of charts from my metrics so I tend to try to take advantage of that. If I just pushed a single counter metrics with a tag for route name and a tag for status_code, then I would get the same result as what I have in Plausible but with a nicer UI. I would also have the option to customize things further in the future, which I almost certainly will want to do.
So all in all this was kinda cool to try, but I will be sticking with Prometheus + Grafana for server-side analytics. The benefit of this was now I can move my client-side analytics from hosted Plausible to my new self-hosted instance.
